
Hurricanes Don't Wait.
Talk to our emergency logistics team before the next storm hits.
Get Help.

Hurricanes can cost businesses money, and it can take them a considerable amount of time to recover. Smaller enterprises in particular can be devastated when this type of storm makes landfall. Understanding the financial costs they can inflict, their intensity, and frequency can help you better prepare.
Key takeaways of our hurricane recovery statistics include:
We’re going to give you hurricane recovery statistics and other data to show the devastating impact these storms can inflict.
There have been a considerable amount of hurricanes in the past few years, many of which have made landfall in the United States. We’ve provided a graphic showing the Atlantic hurricane season between 2020 and 2024.
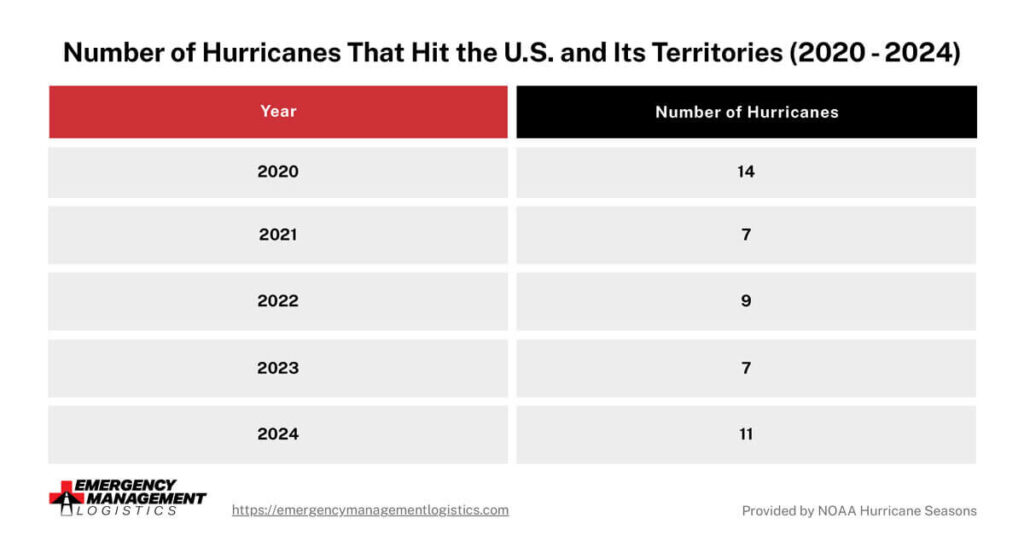
The amount of hurricanes that have occurred over the past five years has roughly floated around the same number, with there being an uptick in 2020 and 2024.
Hurricanes have increased in occurrence and intensity in the past few years. Unfortunately, NOAA predicts the frequency and power of these storms will continue to rise in the years to come.
An increase in rainfall can mean an increase in flash flooding for areas affected by hurricanes. Since maximum winds will rise, damage to buildings and infrastructure will be more severe.
Businesses operating in coastal regions should expect higher levels of damage to their properties and severe disruptions to their supply chain when a hurricane lands.
Hurricanes can cause immense amounts of damage to businesses and residential property, as well as job loss. This primarily applies to homeowners in the southeastern part of the United States.
These statistics show the catastrophic financial impact that hurricanes have on U.S. citizens from all walks of life. One way business owners can prepare for the economic effects of hurricanes is by searching for alternate suppliers when disaster strikes.
Recovery and reconstruction following a hurricane can be a complex process. Depending on the severity of the storm and the extent of the damage, it can take months or even years for infrastructure to be repaired.
Predicting the expenses of these efforts for future hurricanes is difficult. However, we can look at the recovery and reconstruction costs following the five most severe hurricanes in the past 20 years to get an idea of what they could be in years to come.
We’ve included data on the costliest U.S. hurricanes and the states or territories where the storms made landfall.
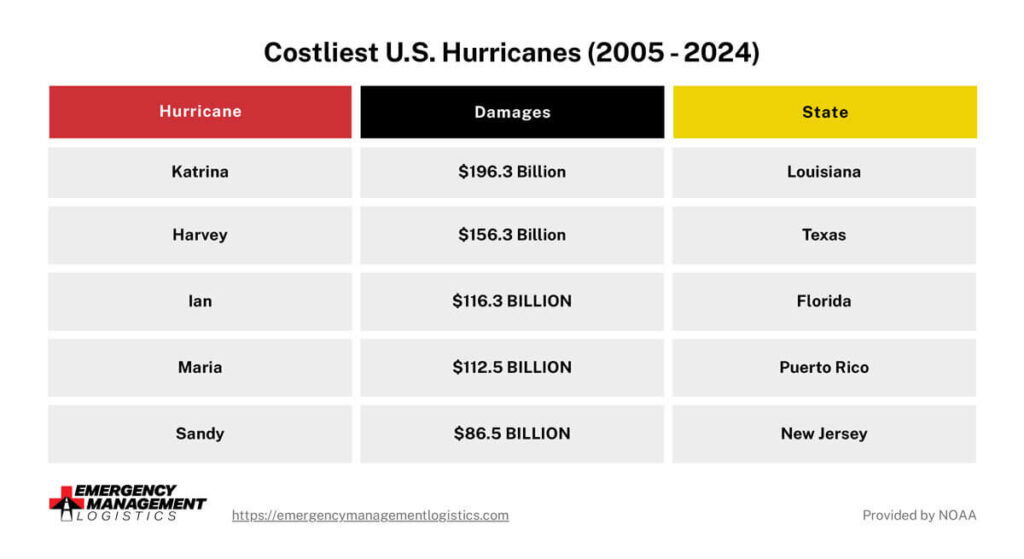
Recovery and reconstruction expenses following these devastating storms were extremely high.
When hurricanes Maria and Irma struck in 2017, it led to severe damages in Puerto Rico and the U.S. Virgin Islands. As of 2022, the Federal Emergency Management Agency (FEMA) provided $32.2 billion and $304.8 million on two recovery and reconstruction grants for both affected by these storms.
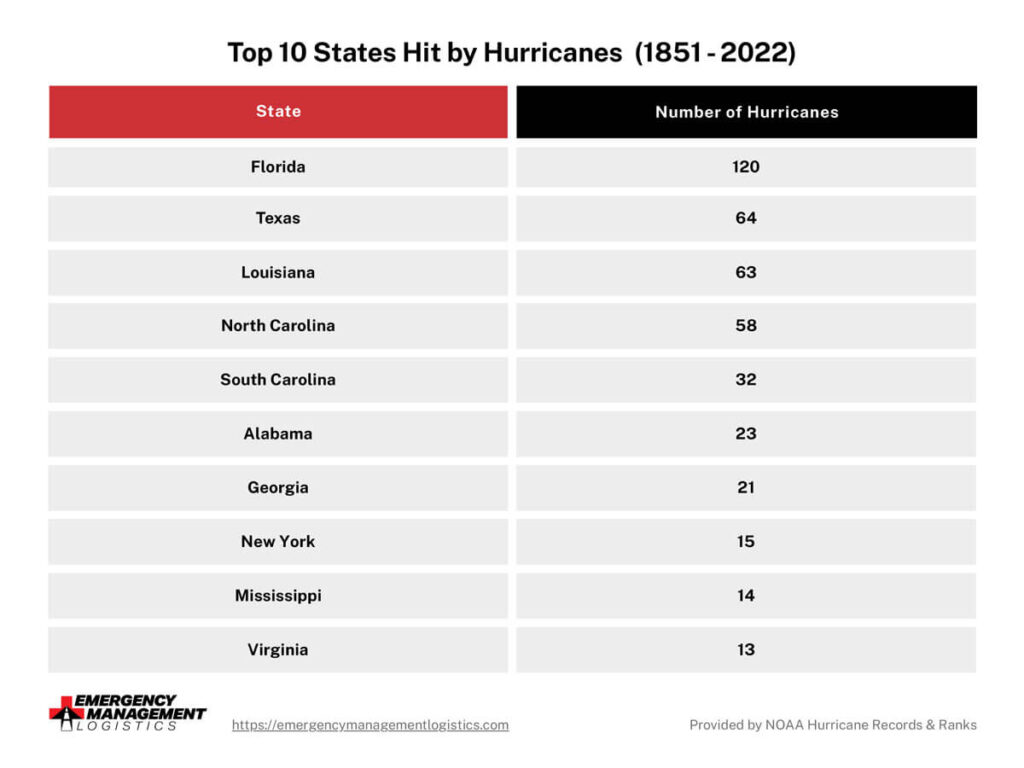
Certain parts of the U.S. are more likely to experience the devastating effects of hurricanes than others. This makes businesses in these regions more prone to the dangers and financial repercussions that occur when these storms make landfall. In the U.S., states along the Gulf and Atlantic Coasts are at the highest risk of experiencing hurricanes.
We’ve created data of the top 10 states in these regions that have received the most hurricanes from 1851 to 2024.
Because of the risk posed by hurricanes, many properties in these states have windstorm insurance. This policy is used to protect against wind damage from storms like tornadoes, hurricanes, and gales.
Numerous properties located in these five states have flood insurance as well. For example, all insurance companies in Florida offer deductible options of $500, 2 percent, 5 percent, or 10 percent.
Neither windstorm nor flood insurance are required by law in these five states. That said, many banks and lenders will require property owners to obtain this level of protection, especially for those residing in coastal areas.
As we've explored throughout this article, the statistics surrounding hurricanes reveal not only their obvious challenges, but also the critical need for expert support and planning. At Emergency Management Logistics, we understand the complexities of post-hurricane recovery and are committed to providing comprehensive solutions tailored to each unique situation.
Our services include:
At Emergency Management Logistics, we're not just a service provider; we're your partner in ensuring safety and resilience in the face of natural disasters. Call us today at (855) 420-9447 or contact us through the site to get the help of a trusted emergency logistics provider.
National Oceanic and Atmospheric Administration, 2023 Atlantic Hurricane Season, 2023
National Ocean and Atmospheric Administration, Hurricane Costs, 2023
National Oceanic and Atmospheric Administration, What Is A Hurricane?, 2023
National Oceanic and Atmospheric Administration, Costliest U.S. Tropical Cyclones, 2023
National Oceanic and Atmospheric Administration, Hurricane Records & Ranks
Congressional Budget Office, FEMA’s Disaster Relief Fund: Budgetary History and Projections
Tom Knuston, Global Warming and Hurricanes, Geophysical Fluid Dynamics Laboratory, 2023
Sung Park, Hurricanes Harvey and Irma: Measuring the Business Impact, Experian, 2017

